
Protect your Community Infographic
Protect your Community
Project Overview
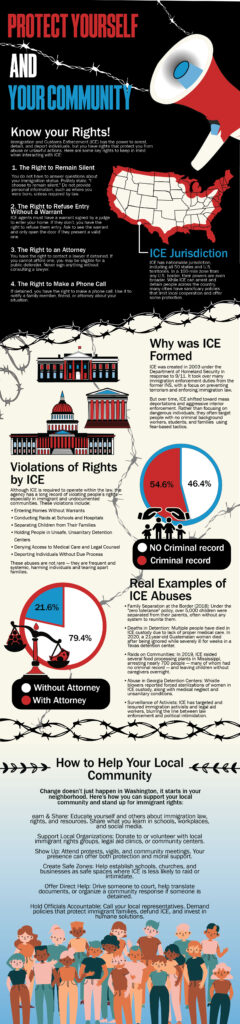
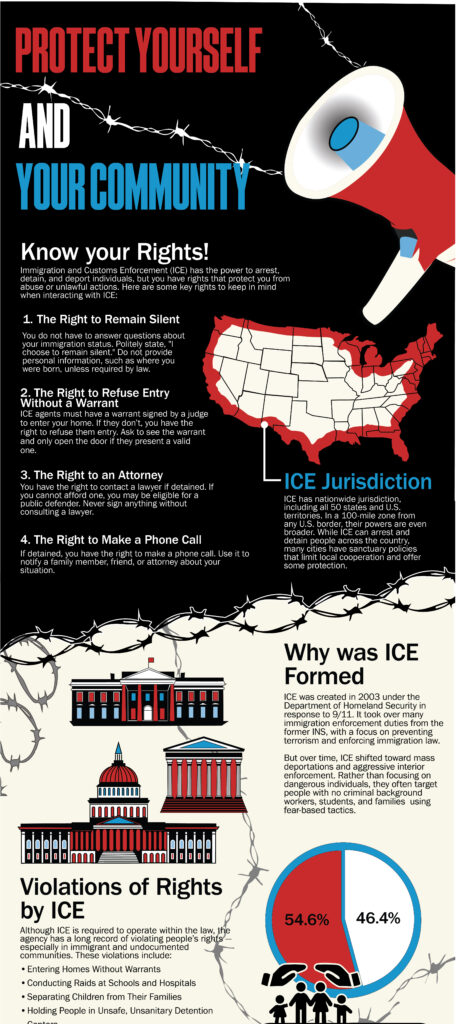
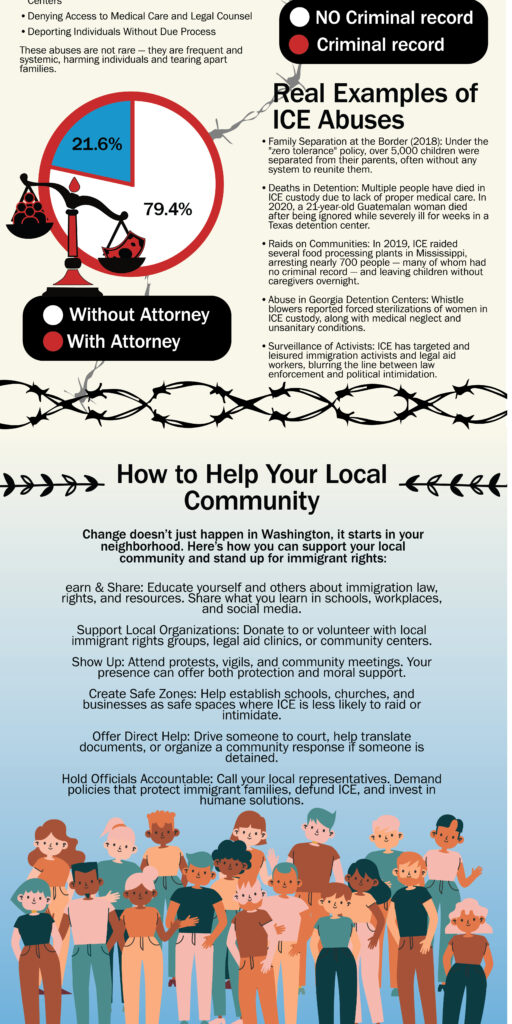
This project focused on creating an infographic about how communities can protect themselves and stay informed regarding interactions with U.S. Immigration and Customs Enforcement. My goal was to present important information in a way that people would be more willing to engage with visually, including statistics, common tactics that may be used during encounters, and practical guidance on what individuals should know in those situations. Because the topic is serious and emotionally heavy, I wanted the design to reflect that weight while still remaining clear and accessible. I used bright, high-contrast visuals against the background to draw attention, while also incorporating red, white, and blue tones to connect the subject to United States and its broader social context. At the bottom of the infographic, I included a section focused on ways people can support their local community, including actions and resources that may help improve safety and awareness for others. One of the biggest challenges was fitting a large amount of information into a limited layout without overwhelming the viewer, which made hierarchy and organization especially important. Through this project, I learned how visual design can make complex information easier to understand and how layout choices strongly affect whether a viewer stays engaged with difficult subject matter.